


-

Tel

WeChat

Search

TOP
 Scan and follow us


News
Classify
Development status of aluminum cans in the world
Metal beer beverage packaging cans have a history of more than 70 years so far. In the early 1930s, the United States began to produce beer cans. the three-piece cans were made of tinplate. the upper part of the cans was conical and the top part was crown - shaped. Its general shape is not much different from that of glass bottles, so it was originally filled with glass bottle filling line, and only in the 1950s did it have a special filling line. The can lid evolved into a flat shape in the mid - 1950s and improved to an aluminum annular lid in the 1960s.
Aluminum beverage cans first appeared in the late 1950s, and two DWI cans were officially released in the early 1960s. Aluminum cans have developed very rapidly. by the end of this century, the annual consumption has reached more than 180 billion, which is the largest category in the worlds total metal cans ( about 400 billion ). The consumption of aluminum used to make aluminum cans has also increased rapidly. in 1963, it was still close to zero. in 1997, it reached 3.6 million tons, equivalent to 15 % of the total consumption of all kinds of aluminum in the world.
The United States is the worlds largest producer and consumer of aluminum beverage cans. The number of aluminum cans used in the United States exceeded 62 billion in 1984, 70 billion in 1987, 80 billion in 1988, 90 billion in 1990 and 100 billion in 1994. U.s. aluminum cans are mainly used for packaging beverages. for example, in 1992, 92.8 billion cans of aluminum were used for beverages, accounting for 97 % of the 95.7 billion cans of that year, while only 2.9 billion cans of iron were used, accounting for 3 %. In 2001, the consumption of American beer and soft drink aluminum cans was nearly 100 billion, of which 64 billion were soft drink cans and 33 billion were beer cans. The production of aluminum cans in Japan has increased for many years, from 3 billion in 1985 to 5.5 billion in 1987, 8.1 billion in 1989, 10.2 billion in 1991, 11.8 billion in 1993, 15.9 billion in 1995 and 16.6 billion in 1997. most of the aluminum cans are beer cans, such as 9.5 billion in 1997, accounting for 57 %, 3.5 billion in carbonated beverage cans, accounting for 21 %, and 3 billion in other beverage cans, accounting for 18 %. Since the mid - 1980s, the European beverage can market has been showing a steady growth trend. In 1990, the consumption of beverage cans in Europe exceeded 20 billion for the first time, reaching 25 billion in 1993 and exceeding 30 billion in 1995. In 1996, it fell by 2 %, from 32.2 billion last year to 31.6 billion. In 1997, the European beverage can market resumed steady growth again, with an annual growth rate of 5 % and total consumption rising to 33.5 billion, the highest level in history. Among them, 18.5 billion cool beverage cans, up 5.1 % over the previous year, and 15 billion beer cans, up 7 % over the previous year. About half of the European beverage cans are tin cans and aluminum cans. The consumption of aluminum cans in central and south America is also relatively large, with nearly 20 billion cans per year. Asia ( except Japan ) also consumes no less than 20 billion aluminum cans per year. Chinas consumption of aluminum cans is now more than 8 billion per year.
For decades, the manufacturing technology of aluminum cans has been continuously improved. The weight of aluminum cans has been greatly reduced. in the early 1960s, the weight of each thousand aluminum cans ( including the body and lid ) reached 55 pounds ( about 25 kilograms ), fell to 44.8 pounds ( 25 kilograms ) in the mid - 1970s, and fell to 33 pounds ( 15 kilograms ) in the late 1990s. it has now been reduced to less than 30 pounds, nearly half of the 40 years ago. During the 20 years from 1975 to 1995, the number of aluminum cans ( 12 ounces in capacity ) made of 1 pound aluminum increased by 35 %. In addition, according to the statistics of Alcoa, the aluminum required for every 1,000 aluminum cans decreased from 25.8 pounds in 1988 to 22.5 pounds in 1998 and 22.3 pounds in 2000. U.s. canning enterprises have made continuous breakthroughs in sealing machinery and other technologies, so the aluminum thickness of U.S. aluminum cans has decreased significantly, from 0.343 mm in 1984 to 0.285 mm in 1992 and 0.259 mm in 1998.
The lightweight progress of aluminum can lid is also obvious. The thickness of aluminum material for the can lid decreased from 0.39 mm in the early 1960s to 0.36 mm in the 1970s, from 0.28 mm to 0.30 mm in 1980, and to 0.24 mm in the mid - 1980s. The diameter of that can lid is also reduce. The weight of the can lid is continuously decreasing. in 1974, the weight of 1,000 aluminum cans was 13 pounds, in 1980 it was 12 pounds, in 1984 it was 11 pounds, in 1986 it was 10 pounds, in 1990 and 1992 it was 9 pounds and 8 pounds respectively, and in 2002 it was 6.6 pounds. The speed of making cans has greatly increased, from 650 - 1000 CPM ( only per minute ) in the 1970s to 1000 - 1750 CPM in the 1980s and above 2000 CPM now respectively.
Many countries, especially developed countries, attach great importance to the recycling and reuse of spent metal cans, and the recycling rate of metal cans is also increasing. For example, the recycling rate of aluminum cans in the United States has exceeded 50 % since the 1980s, 63.6 % in 1990, 65.4 % in 1994, 66.5 % in 1997, 62.5 % in 1999 and 62.1 % in 2000. The recycling rate of aluminum cans in Japan increased from 43 % in 1990 to 58 % in 1993, 70 % in 1996, 79 % in 1999 and 83 % in 2001 respectively.
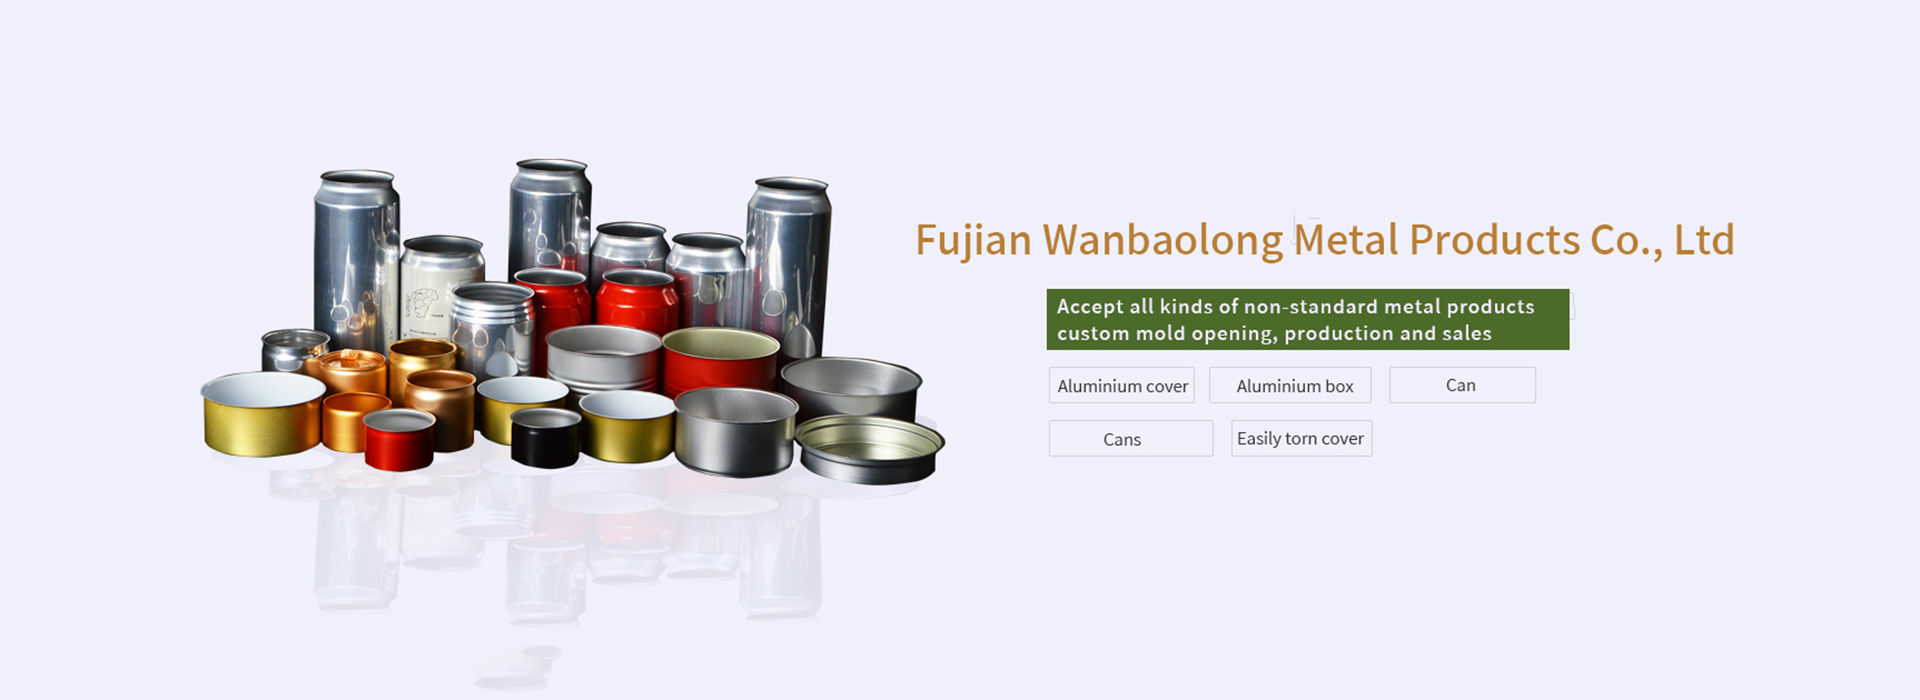
Fujian wanbaolong metal products co., ltd. Industry and Information Technology Filing:京ICP證000000号Public Security Filing: Technical Support:Xiamen Yiertong Network Technology Co., Ltd
Technical Support:Xiamen Yiertong Network Technology Co., Ltd